stress and me Part 2 of 3
This part of my report is about stressors and what they do to us. If you would first like to know why I am dealing with stress, what stress actually is, and why it can make you ill, then read the first part of my report first.
The survey
If I had known what kind of work a survey like this is, I might have changed my mind. It requires a fair amount of knowledge, on the one hand on topics such as methodology, ethical issues as well as data protection, and the topic of insider research, i.e. when you are researching a group to which you belong. But then, of course, a lot of statistics. For example, how many people do I need to interview to ensure that my survey is representative? How do I find out whether my results are reliable? How do I rule out chance? All these things can be calculated statistically and I owe it to Madina Kukenova, my professor of finance and statistics at the Swiss School of Higher Education, that I was able to get my feet on the ground at all.
My calculations (and Madina's) have shown that I need 1,067 data sets for a representative survey. The formula is as follows:
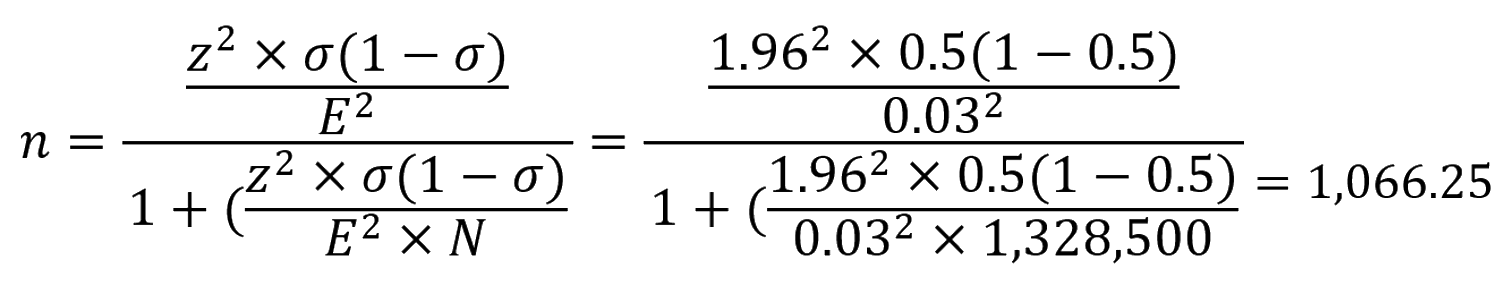 |
That's a pretty ambitious number of participants, but thanks to you I ended up with 1,142 usable data sets, which is enough. But now to the topic:
I wanted to know the following:
- Is there a link between the event industry, increased stress levels, and an increased incidence of stress-related illnesses?
 |
And I clarified in the first part:
- What stress actually is and
- the current state of research on stress-related diseases.
In order to answer my question, my survey had to provide the following insights:
- What stressors do we have in the events industry?
- Do we have increased levels of stress?
And I want to find out
- whether stress and stress levels are linked.
In the third part of my report, I will investigate
- whether we have more stress-related diseases in the event industry and
- whether stress levels and stress-related diseases are connected.
stressors in the events industry
To make the topic of stressors somehow more tangible, I looked for a classification of stressors. The University of Concordia in Montreal, Canada, offers a good summary of current stress research as well as a clear classification of stressors (Examples of Stressors, 2020). I adopted this classification and adapted it to the events industry.
The following picture emerged from the survey:
 |
In the graphic you can see all the stressors that I asked about, sorted according to the frequency with which they occur in the respondents. It is important to note here that only the data sets in which a stressor occurs regularly or almost always are displayed. Here you can see, for example, that 81% of all respondents are at least regularly exposed to time pressure and 70% stated that they do not have enough time for their hobbies. Only around five percent of all participants regularly took downers or had to work in heavy rain and around 9% have already lost their better half for work reasons.
The table says nothing about whether and how much stress is triggered by the individual stressors. You will remember from part 1 that I explained why a stressor alone is not enough to trigger stress.
It was therefore very important to find out how stressed we really are.
measuring stress
As you can imagine, it's not that easy. Stress is pretty subjective. And if I simply ask my group how stressed they are on a scale of 1-10 and I find out, for example, that the average is 7, that doesn't tell me whether it's more or less than the rest of humanity.
So we needed a validated tool. One that is so widely used that I have comparative values. And that tool for me was the Perceived Stress Scale (PSS) by Cohen et al. (1983). The PSS-10 has been used for decades to measure stress levels in clinical studies.
Respondents answer 10 questions. The answers are used to calculate a score that determines how stressed the respondent is.
Cohen et al. themselves surveyed 2,387 Americans in 1983 and determined an average stress score of 13.06. In a similar study by Klein et al. in 2016, 2,463 German people were surveyed and the average stress level was 12.57. I have used this last value as a comparative value. Firstly, because it is more recent, and secondly, because it relates to the German cultural area.
I am leaving out quite a lot in this report. That's because I don't think it's of interest to most people. I would therefore like to take this opportunity to refer you to the full study, which you can read here if you have any questions about the methodology, the demographics of the respondents, the distribution channels of the survey and much more.
So, on to the PSS score from my survey. The average score in the group was 16.96 - significantly higher than the German average. However, it was difficult for me to imagine - based on just two figures - whether this was significantly more or just a little more. So I was interested in what kind of PSS score people have who are really stressed at work. So I did a bit of research again. And because this PSS is very common, I found a study from 2007 in which McAlonan et al. studied a group of high-risk healthcare workers during a pandemic in Israel. And they found a stress level of 17.
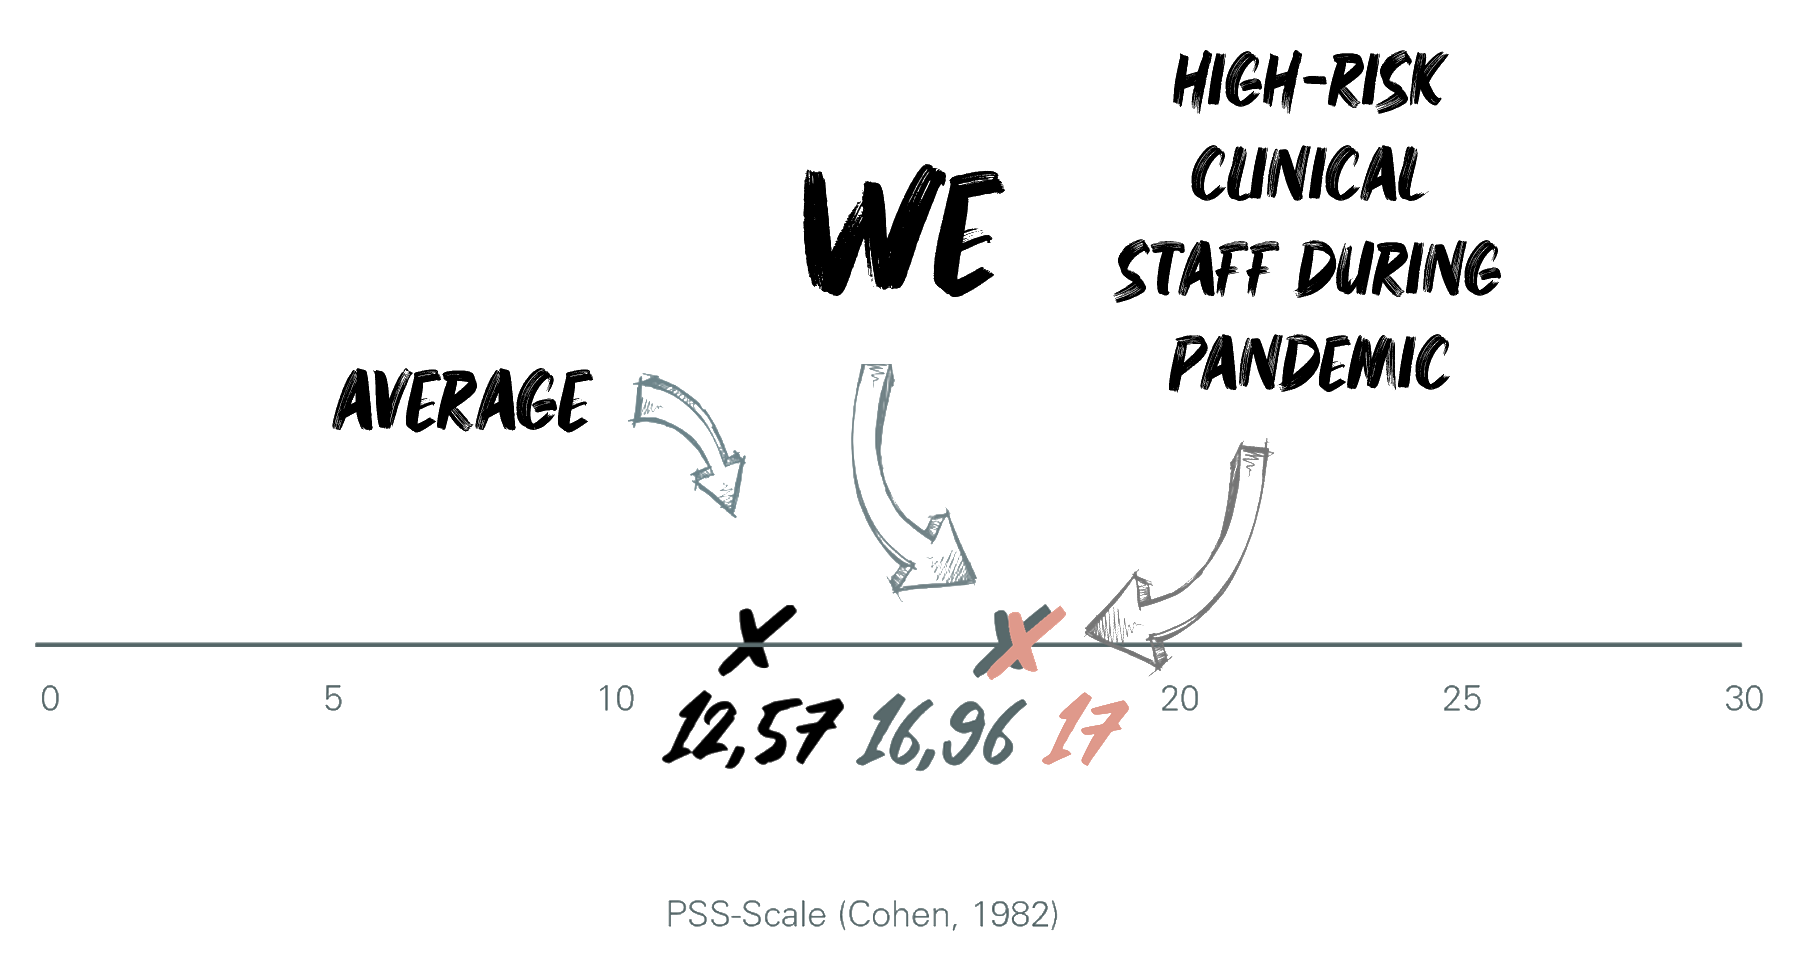 |
If you look at it now, it doesn't look so good. But there were also interesting observations within the surveyed group:
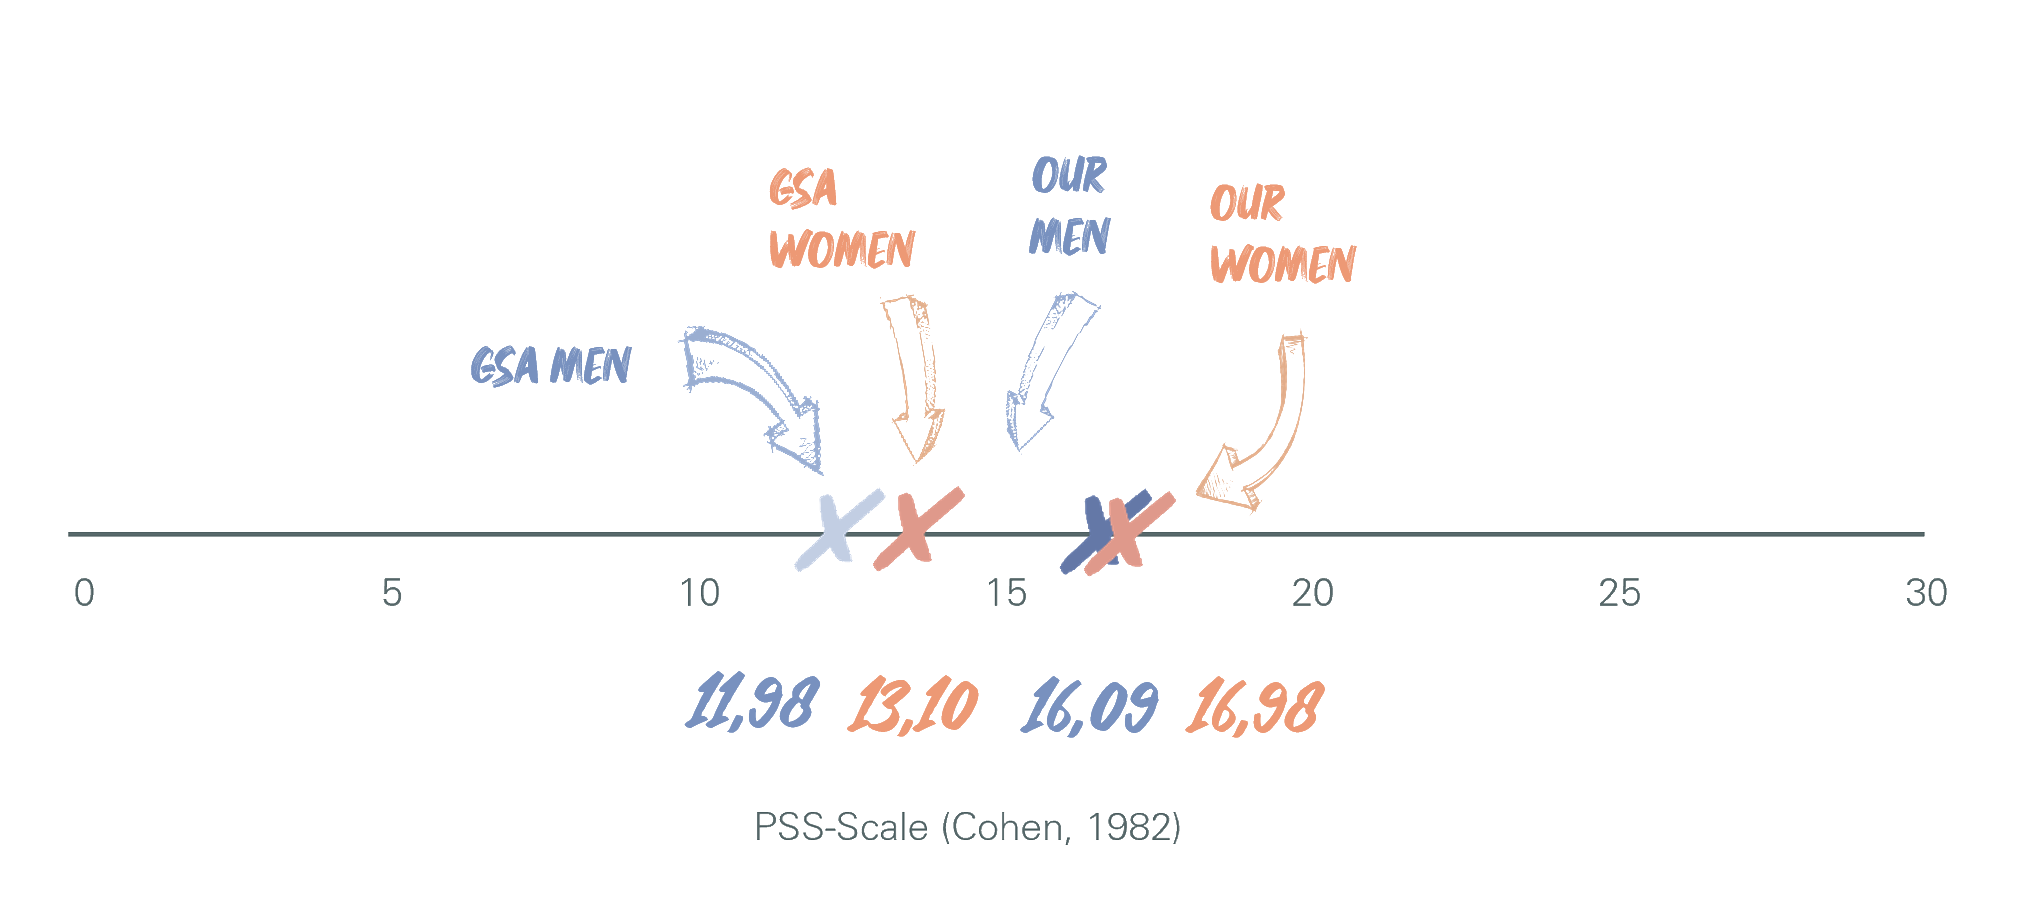
Firstly, I looked at the difference between men, women and non-binary people. Women generally have a higher PSS score than men, as shown in many studies, and this is also the case with us. Our men score 16.09 and our women 16.98. Why this is the case is an interesting topic. If you're interested, you can read more here. The seven non-binary participants have an average of 17.01, which is unfortunately not meaningful due to the small number of data. But there are also interesting facts about this, because the average LGTBQ person also has more stress than the rest of the population.
 |
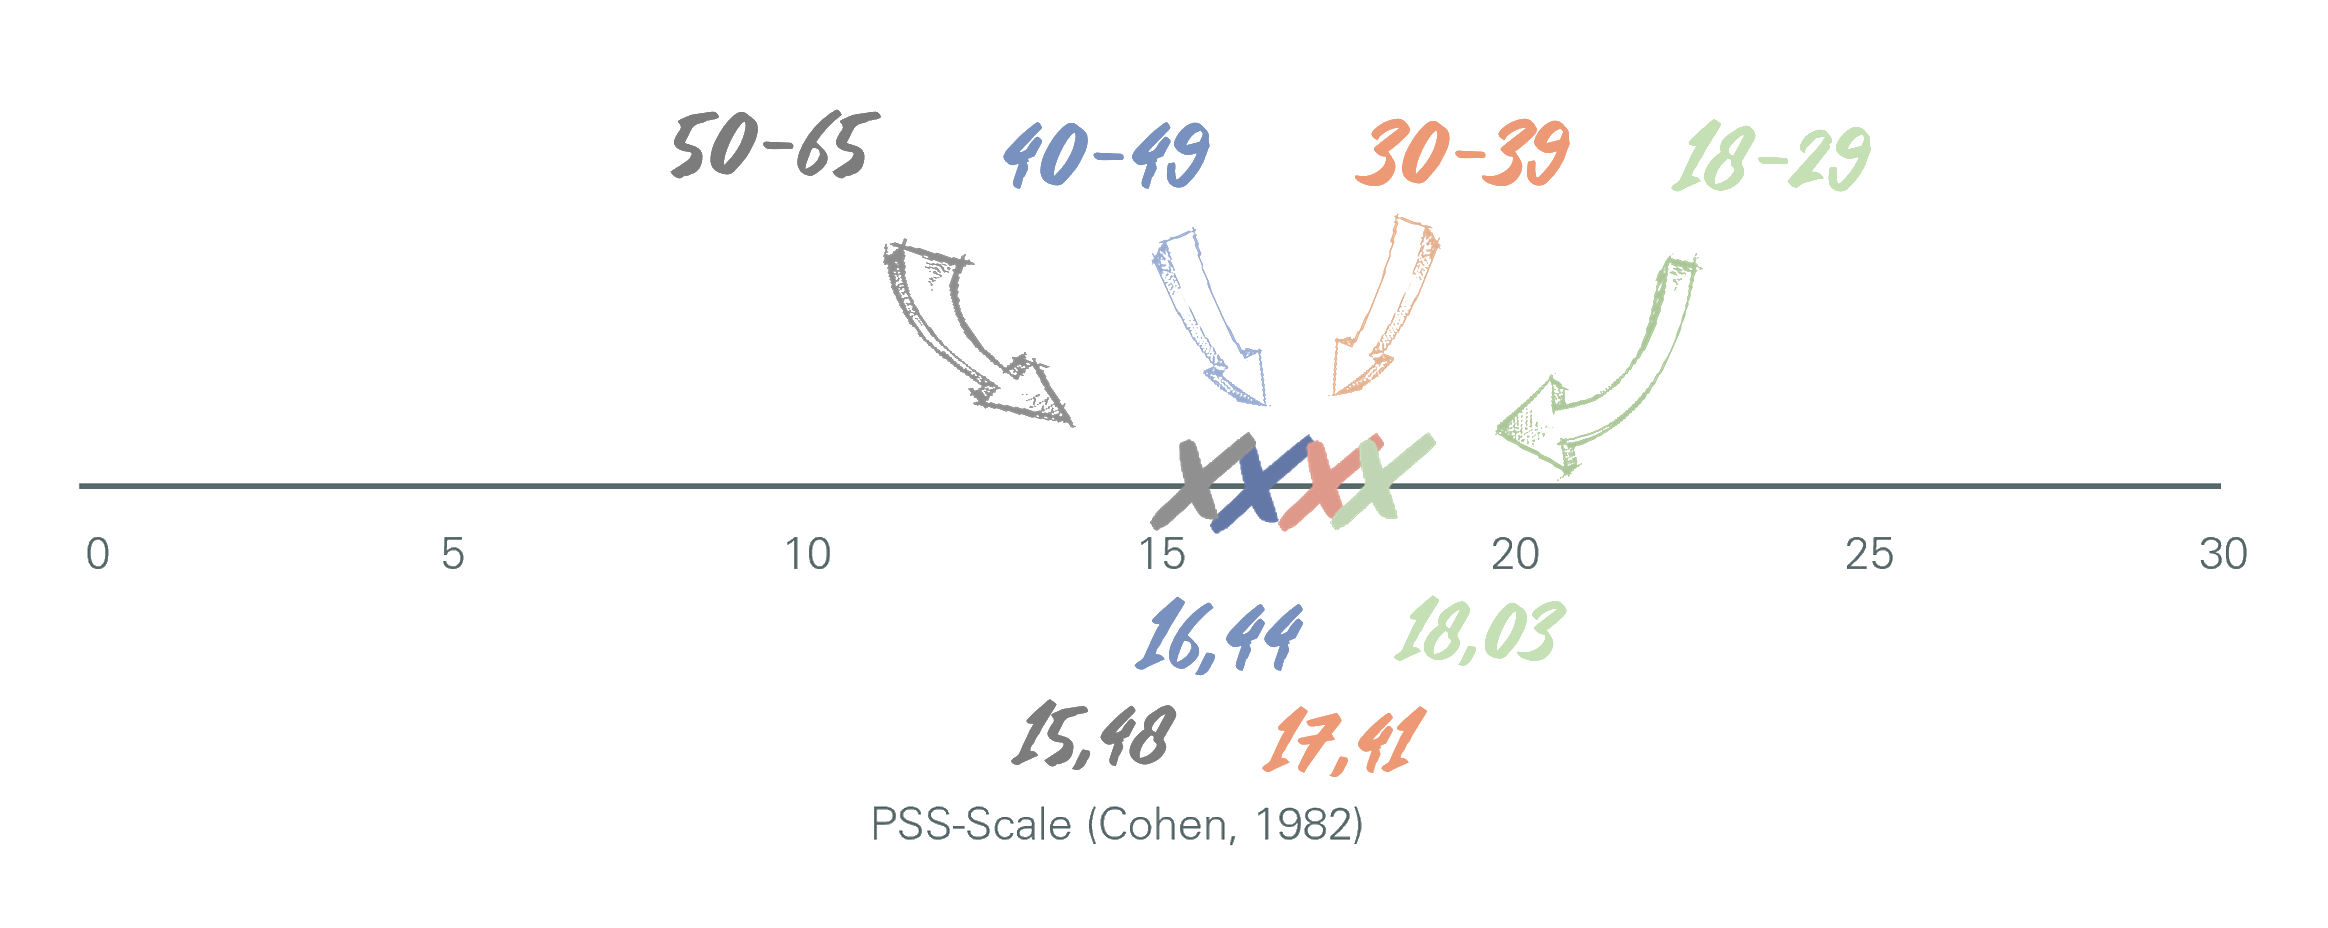
Then I looked at the age groups. The age group 18-29 has the highest score (18.03), and this goes down proportionally as you can see in the graph. The older we get, the less stressed we are by stressors. This is called resilience. So we become more resilient to stressors as we get older. This phenomenon can also be seen in other studies, so it is completely normal. Nevertheless, we are significantly more stressed overall than the comparison groups.
 |
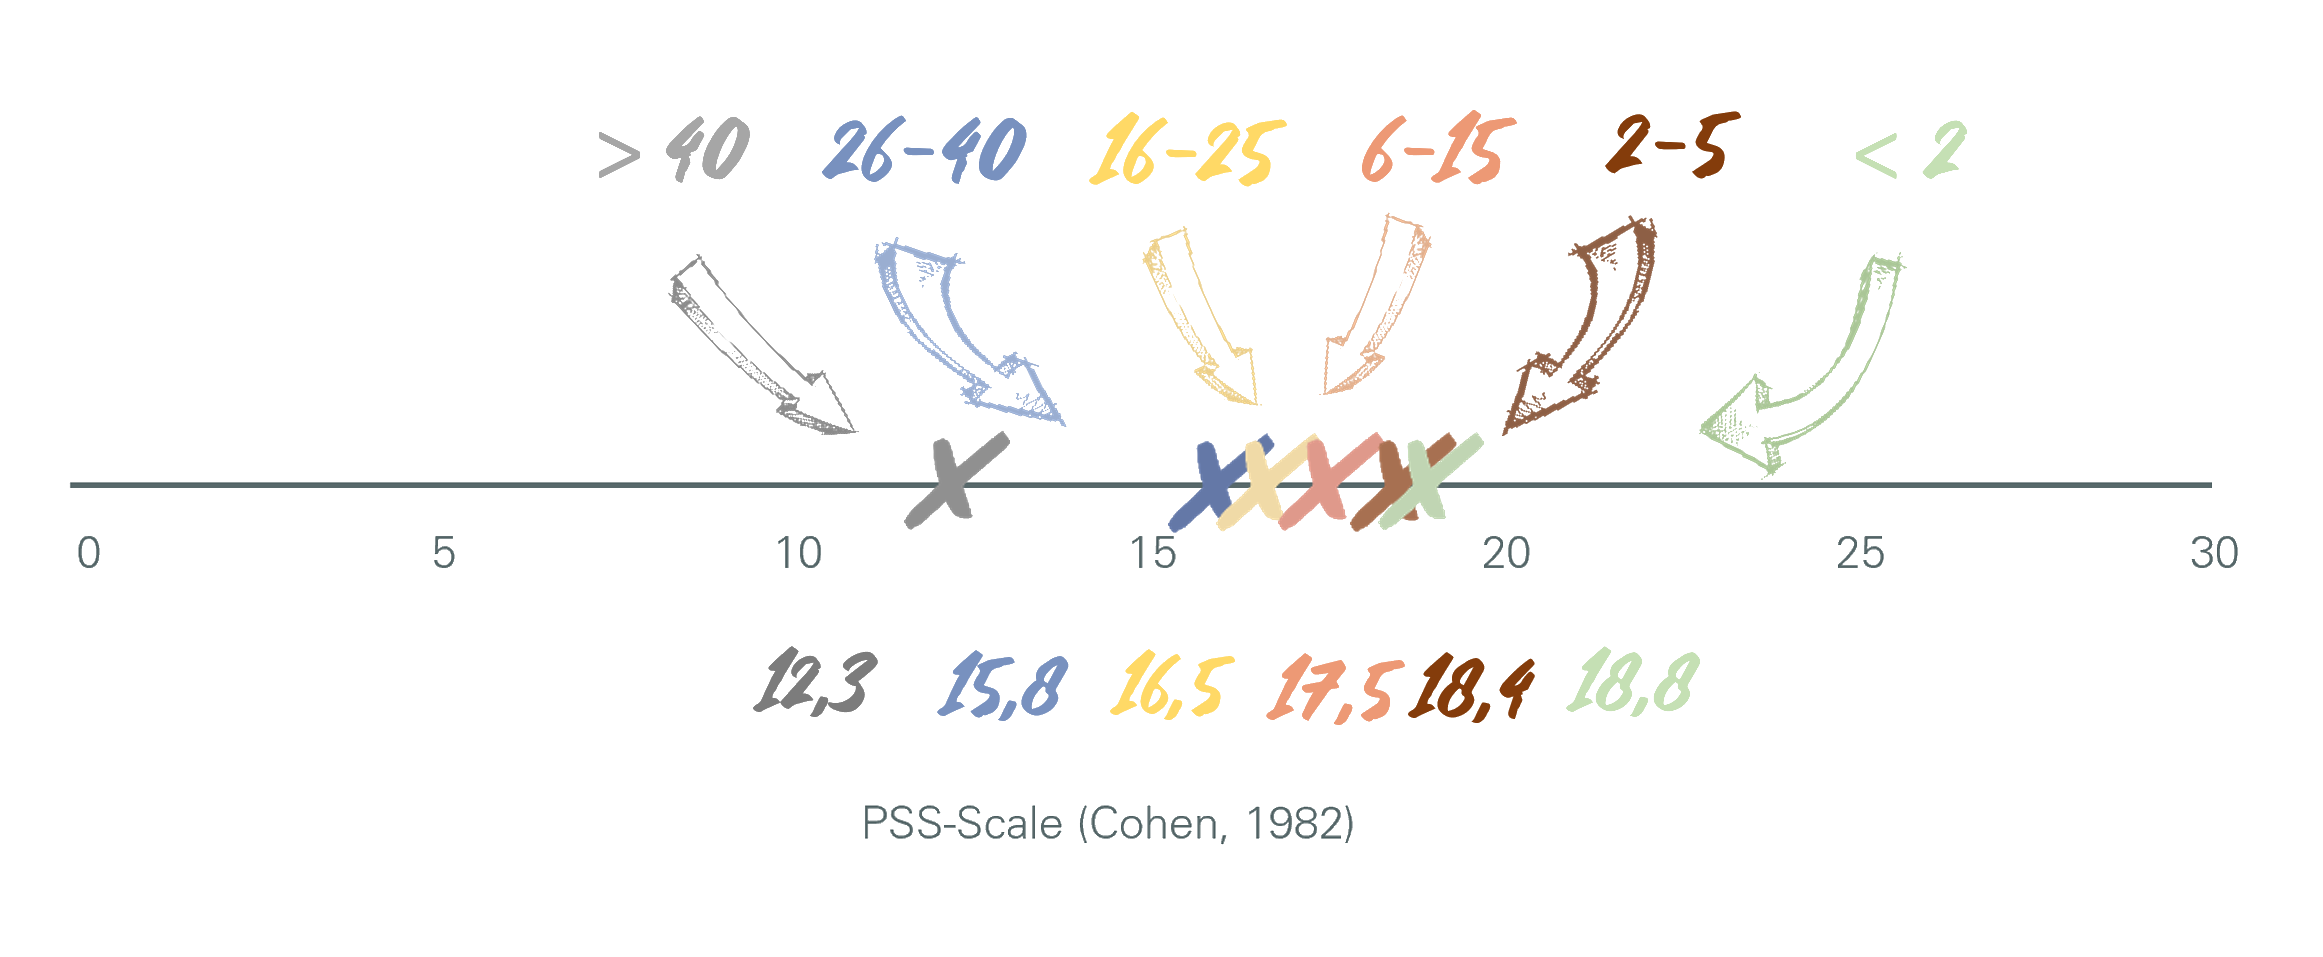
I noticed the same phenomenon with the length of time spent in the industry. People who are new to the industry have the most stress (18.78) and this then gradually decreases until people who have been in the industry for 40 years or more have an average of 12.31. Incidentally, this group of participants is the only group that is below the average of 12.57 for the German population. It can be assumed that people who are new to the industry are younger than those who have been in it for a long time. This is therefore not surprising.
 |
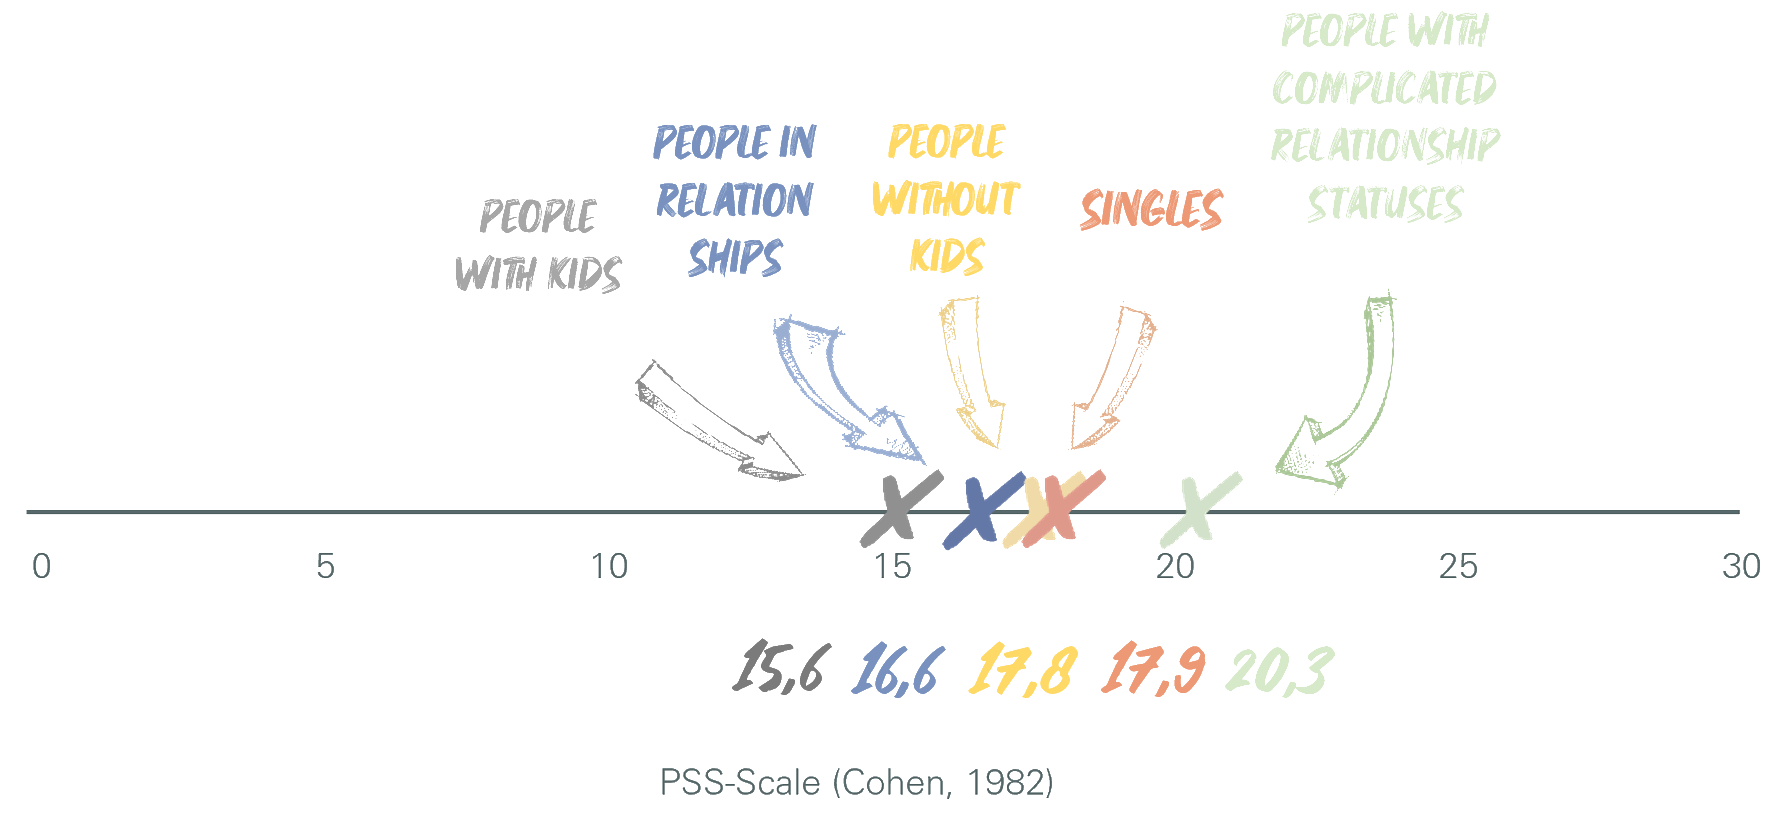
Lastly, I looked at what the family situation has to do with stress. I found that people who are in a relationship (of any kind) and/or have children are less stressed than their single and childless colleagues. And as with all other points, this observation is not unique. In the study by Klein et al.. mentioned above, all of these things can also be observed. The only difference is that all of these phenomena occur at an overall lower stress level in Klein's study.
Fun fact: Those who stated "other" when asked about their relationship status (there were only three) had a PSS score of 20.33 (the highest within the group). A relationship status of "it's complicated" therefore seems to be rather stressful.
 |
The connection between stressors and stress
To explain why it's important to explore the connection, I'd like to share a little anecdote from Elizabeth Gilbert:
"Statistical studies have proven beyond a shadow of a doubt that in America, most people drown in geographic areas with high ice cream sales. Of course, this doesn't mean that buying ice cream causes people to drown. Rather, it means that ice cream sales are highest on beaches and people drown on beaches because that's where water is most abundant. Linking the two completely unrelated concepts of ice cream and drowning is a perfect example of a logical fallacy."
I wanted to rule that out. To stick with this example, you could, for example, analyse the people who drown and compare them with those who don't drown. It is very likely that the ice cream consumption of the two groups will not differ significantly.
That's why I did something similar with my group. I analysed the people in my group who stated that they were exposed to certain stressors at least regularly or almost always and compared their stress levels with the average. If there was no correlation between the two factors, the stress levels would probably be similar. In my study, however, the stress levels of those who are exposed to many stressors were all, without exception, above the average for the group.
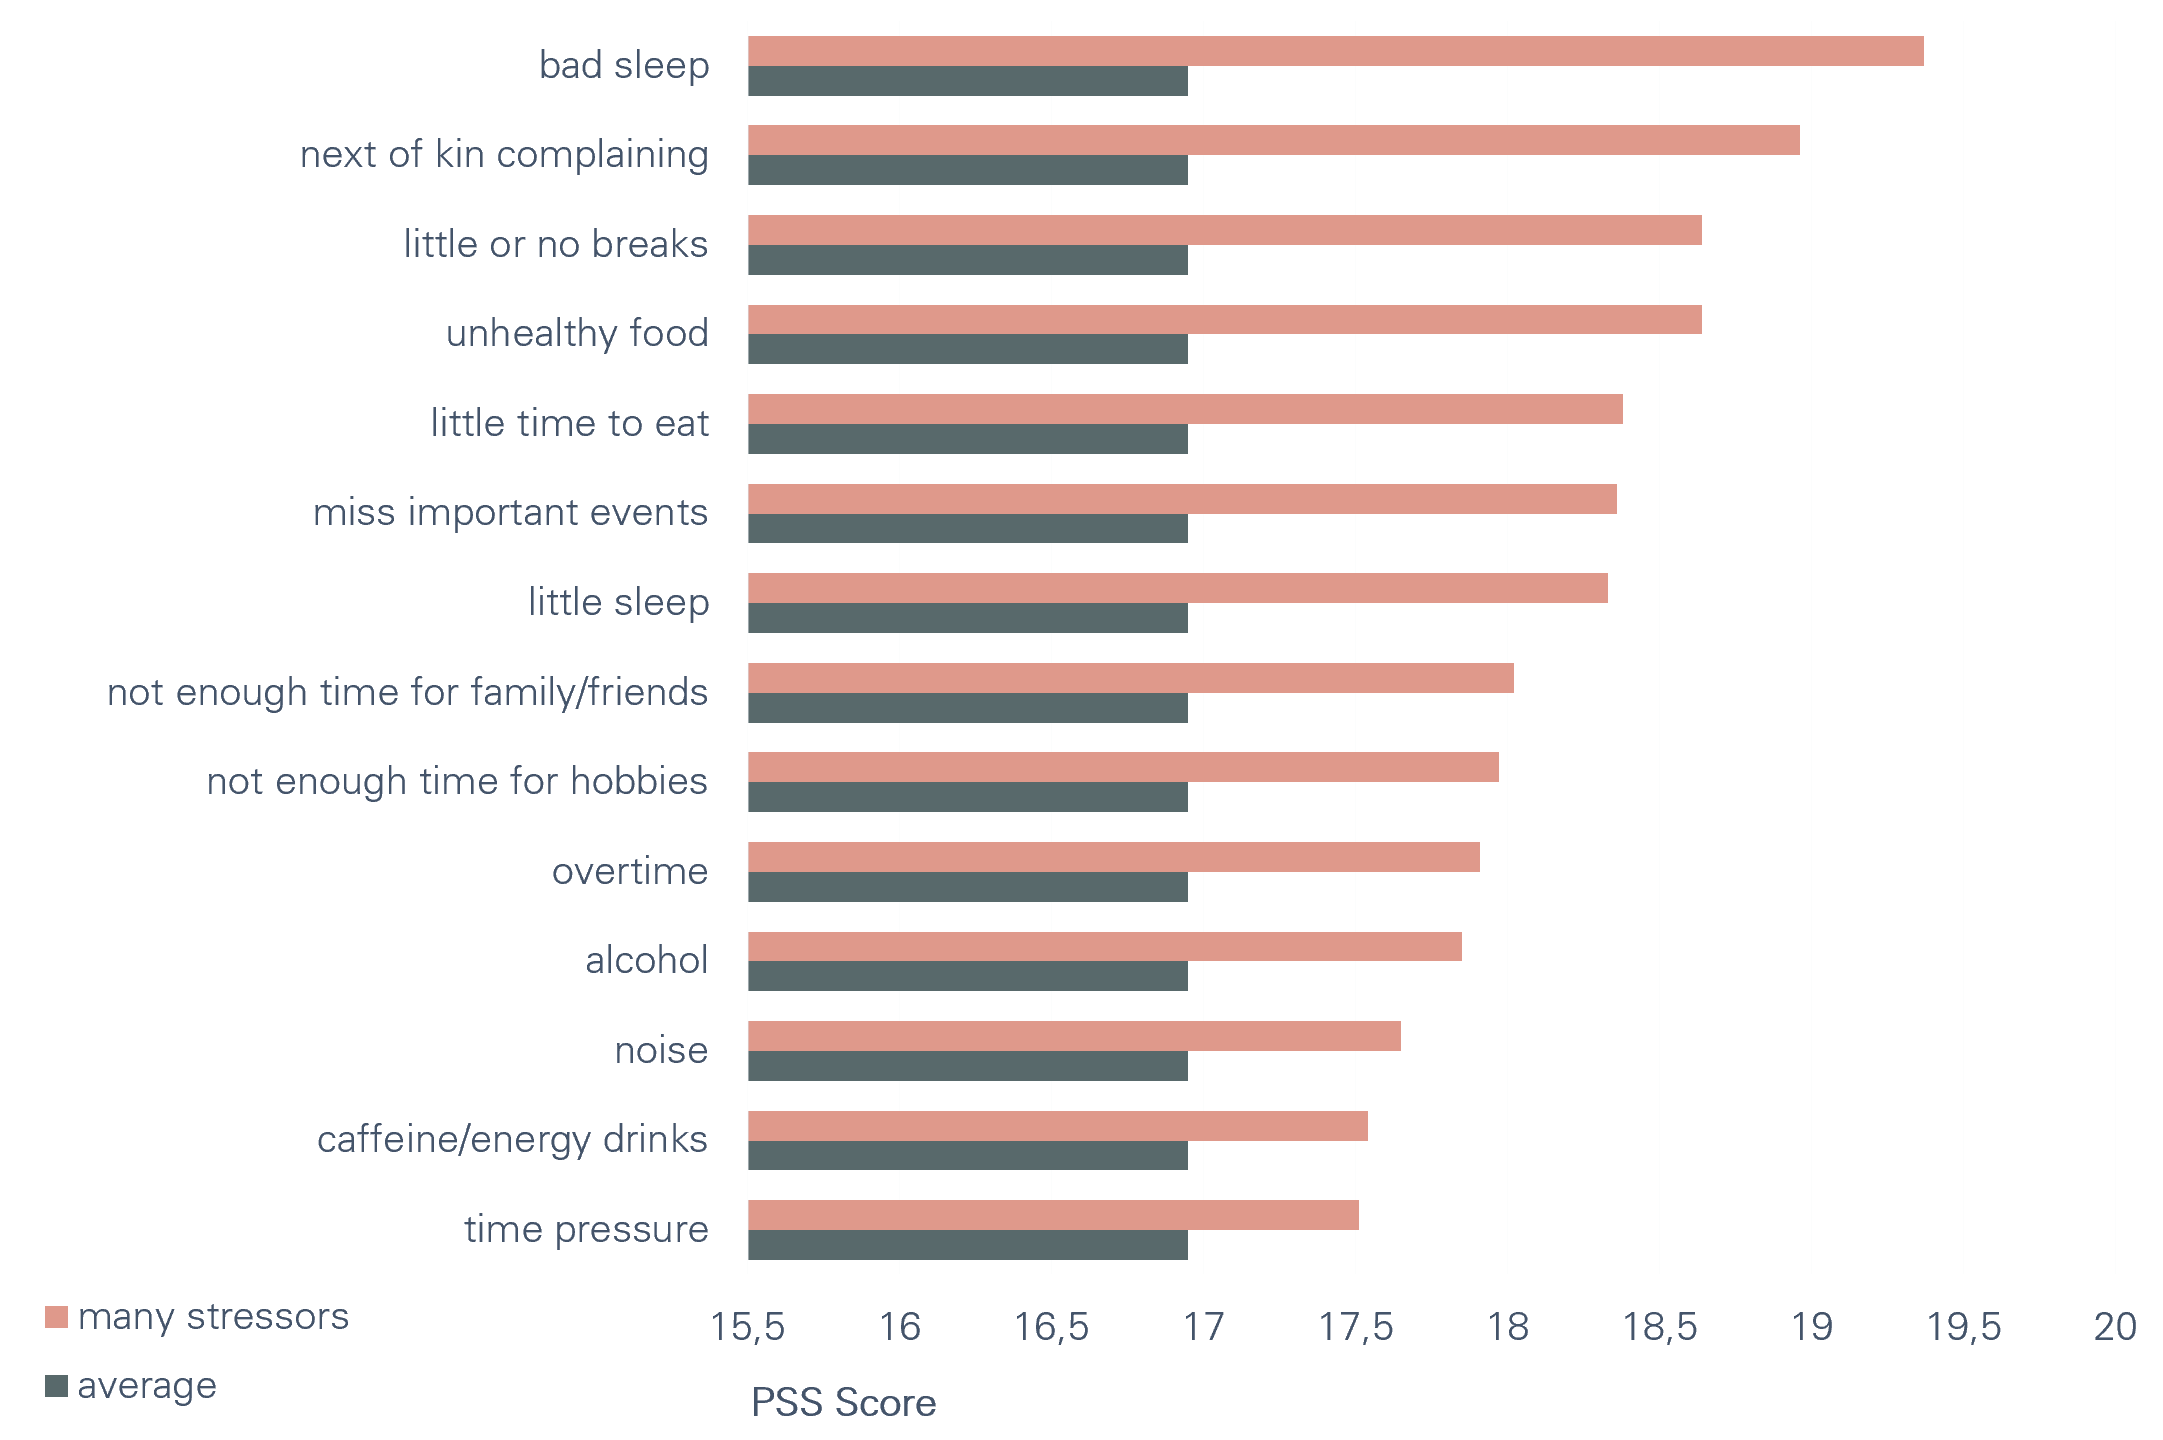 |
The reason why not all stressors are shown here is that sometimes only very few participants were particularly exposed to this stressor. If this is the case, such figures are not meaningful enough, which is why I did not look at these stressors (although all stress levels were above average there too).
However, you can see in the graph that the average for my group is 16.96 and the groups with high levels of stress from stressors, for example, show 17.5 points for time pressure and even 19.3 for poor sleep. What you can also see is that not every stressor affects people in the same way. As you remember from Part 1: not every stressor necessarily leads to stress. You can see that very clearly here.
But back to the point: with this study, I have established the link between the stressors and the stress level. To be on the safe side, I also analysed this the other way round, i.e. I looked at those who stated that they are almost never or never exposed to certain stressors and found that their stress levels are consistently below average.
 |
It can therefore be assumed that there is a connection between the identified stressors and the increased stress levels.